


According to Forbes, data scientists and analysts spend 60% of their time on cleaning and organizing data. This shows how important data cleaning and data wrangling are in a project.
Data cleaning consists in cleaning the data we’ll use, so we don’t have incorrect, corrupted, duplicate, or incomplete data. Real-world data isn’t as clean as most datasets you work with on an online course. This makes data cleaning essential in real-world projects.
In this guide, we’ll review the most common pandas functions used in data analysis.
Reading the datasets
To follow this tutorial you need to have Python and pandas installed. To install pandas, run the command below on the terminal.
pip isntall pandasNow that we have pandas installed, let’s have a look at the data we’re going to work with. This is a football dataset that contains historical information about the FIFA World Cups from 1930 to 2022. You can download all the datasets on my GitHub or Google Drive.
To read these three CSV files, we use the .read_csv method.
df_historical_data = pd.read_csv('fifa_worldcup_matches.csv')
df_fixture = pd.read_csv('fifa_worldcup_fixture.csv')
df_missing_data = pd.read_csv('fifa_worldcup_missing_data.csv')df_historical_data: matches played from 1930 to 2018df_missing_data: missing matches to add to df_historical_datadf_fixture: fixture of the World Cup Qatar 2022
Let’s clean these 3 datasets! To clean the data, we’ll use some common pandas functions used in data analysis.
Removing leading and trailing spaces with .strip
Let’s start by cleaning the df_fixture dataframe. Let’s have a look at this dataframe.
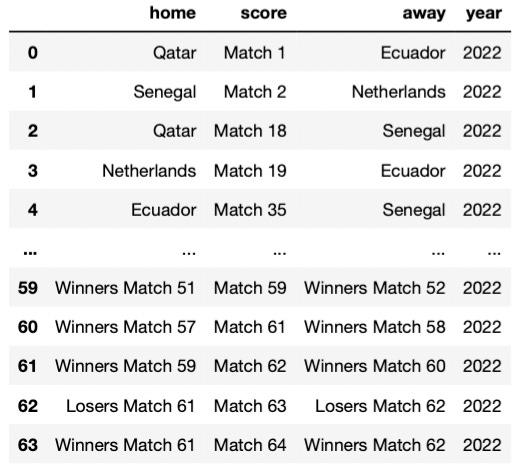
Apparently, everything is fine, right?
Nope! There’s something wrong with it — there are leading and trailing spaces inside the strings in the home and away columns. They’re just not easy to spot.
Instead of having only the country names, we have white spaces before or after the name of the country. Such white spaces could spoil our analysis later, so we have to remove them using .strip.
df_fixture['home'] = df_fixture['home'].str.strip()
df_fixture['away'] = df_fixture['away'].str.strip()
That’s it for the df_fixture dataframe. Now let’s continue with another dataframe.
Identifying NaN data with .isnull and dropping it with .dropna
Now let’s clean the df_missing_data dataframe. The problem with this dataframe is that it has NaN data.
We can verify this is true by using .isnull.
df_missing_data[df_missing_data['home'].isnull()]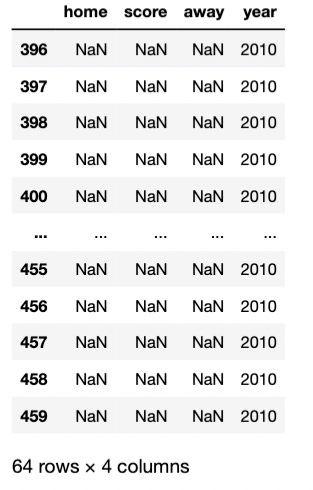
Now we have to remove all those rows that have NaN values. To do so, we use .dropna.
df_missing_data.dropna(inplace=True)Concatenating 2 dataframes with .concat and dropping duplicates with .drop_duplicates
Now that df_missing_data is cleaned we can add it to the historical data inside df_historical_data using .concat.
df_historical_data = pd.concat([df_historical_data, df_missing_data], ignore_index=True)The issue with joining 2 dataframes is that we might have the same data inside both dataframes, so when we combine them, we could get duplicates. This is why we use the drop_duplicates to remove the potential duplicates we can get. In addition to that, we’ll sort the dataframe by year.
df_historical_data.drop_duplicates(inplace=True)
df_historical_data.sort_values('year', inplace=True)
Here’s how df_historical_data looks now.
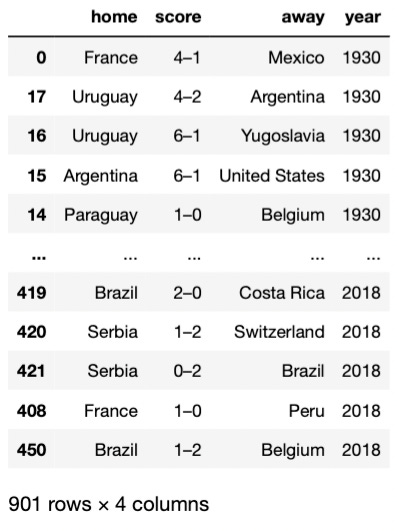
This final dataset has 901 rows, which represent the 901 matches played in all the World Cups.
Spotting anomalies with .contains and removing them with .drop
Now it’s time to clean the df_historical_data dataframe. We’re going to start by removing the anomalies that we don’t wish to include in our final datasets.
Based on the goal of a project, we can either remove or keep a record. I plan to use this dataset to predict the winner of the World Cup 2022 based on the goals scored by each national team. Keeping that in mind, I don’t want to include matches that result in “walkovers” (w/o) because that awards a team, if the other team has no players available, or they have been disqualified.
In World Cup history there was one match that ended in a walkover — Sweden vs Austria. To look for walkovers, we can use .contains with the string “w/o” in the score column. We can also look for “Sweden”/“Austria” in the home/away columns.
delete_index = df_historical_data[df_historical_data['home'].str.contains('Sweden') & df_historical_data['away'].str.contains('Austria')].indexAfter we spot the anomaly, we remove it with .drop.
df_historical_data.drop(index=delete_index, inplace=True)Using regex to spot inconsistencies and replacing them with .replace
Real-world data is inconsistent. Some columns might follow a pattern in the preview of the dataframe but if you explore it row by row, you might encounter inconsistencies that can spoil your project.
In our dataset the score column apparently follows the format “HomeGoals-AwayGoals” but some rows have some extra information. To spot such rows we can use regular expressions (regex).
If we use the regex [^\d–], we can find characters that are not digits or –.
df_historical_data[df_historical_data['score'].str.contains('[^\d–]')]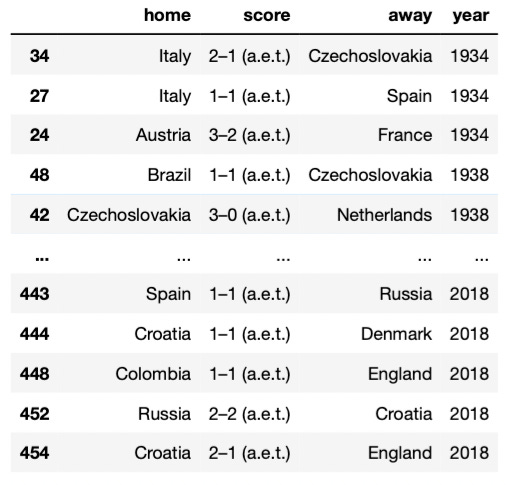
Now to replace anything that’s not a digit or — with an empty string, we use .replace.
df_historical_data['score'] = df_historical_data['score'].str.replace('[^\d–]', '', regex=True)Finally, we make sure that the home/away columns don’t have white spaces.
df_historical_data['home'] = df_historical_data['home'].str.strip()
df_historical_data['away'] = df_historical_data['away'].str.strip()
With this, the cleaning is done! Now it’s time to transform our data so it’s ready to be used in a project.
Splitting strings within a column with .split
Typically, we want that columns have numeric data only and not symbols like the –. To get rid of the hyphen, we’ll use .split and turn on the expand parameter to put the output in two new columns “HomeGoals”, and “AwayGoals”
Then we drop the score column with .drop.
df_historical_data[['HomeGoals', 'AwayGoals']] = df_historical_data['score'].str.split('–', expand=True)
df_historical_data.drop('score', axis=1, inplace=True)
Renaming columns with .rename and changing data types with .astype
Let’s rename our column names so they look much better.
df_historical_data.rename(columns={'home': 'HomeTeam', 'away':'AwayTeam', 'year':'Year'}, inplace=True)Also, let’s see the current data types using .dtypes and verify they have the right data type.
df_historical_data.dtypes
As we can see, the HomeGoals and AwayGoals columns have object data type. To convert this data type to int we have to use .astype.
df_historical_data = df_historical_data.astype({'HomeGoals': int, 'AwayGoals':int})Exporting dataframes
Finally, we can export our clean datasets to CSV using the .to_csv method. Let’s export the df_historical_data and df_fixture.
df_historical_data.to_csv('clean_fifa_worldcup_matches.csv',index=False)
df_fixture.to_csv('clean_fifa_worldcup_fixture.csv',index=False)
That’s it! Now our data is ready to be used in a project.