
We Tried Claude in Excel. These Are The Best Use Cases
How to use Claude in Excel + 3 real use cases: data cleaning, dashboards, and a SaaS financial model — tested with prompts you can copy.


Hi!
Today, Ashwin Francis and Raghav Mehra are sharing with us a Claude in Excel guide. They write Cash&Cache, a weekly newsletter with AI build guides, product teardowns, and strategy that helps you figure out what actually works. Check out Cash&Cache for insights that changes how you work with AI.
Many AI tools say they can handle spreadsheets.
So you upload your file and ask it to clean the data. It gives you a formula. You paste it into Excel. It breaks.
You go back. “That formula doesn’t work.” Your AI tool apologizes. Gives you another one. That one breaks too! Thirty minutes of back and forth. You're still copying formulas from a chat window into a spreadsheet like it's 2023.
Claude in Excel skips all of that.
It reads your actual cells, writes the formulas directly, and builds the dashboard inside your spreadsheet. No copy-pasting. No broken formulas from a chatbot that can't see your data.
As a data analyst, I’ve wanted to write a guide like this for a while, and I’m happy to share this piece, co-authored with Ashwin and Raghav
How to install Claude in Excel
The installation is quite straightforward
Open Excel, go to Home → Add-ins (or Insert > Get Add-ins) → search for “Claude by Anthropic.”
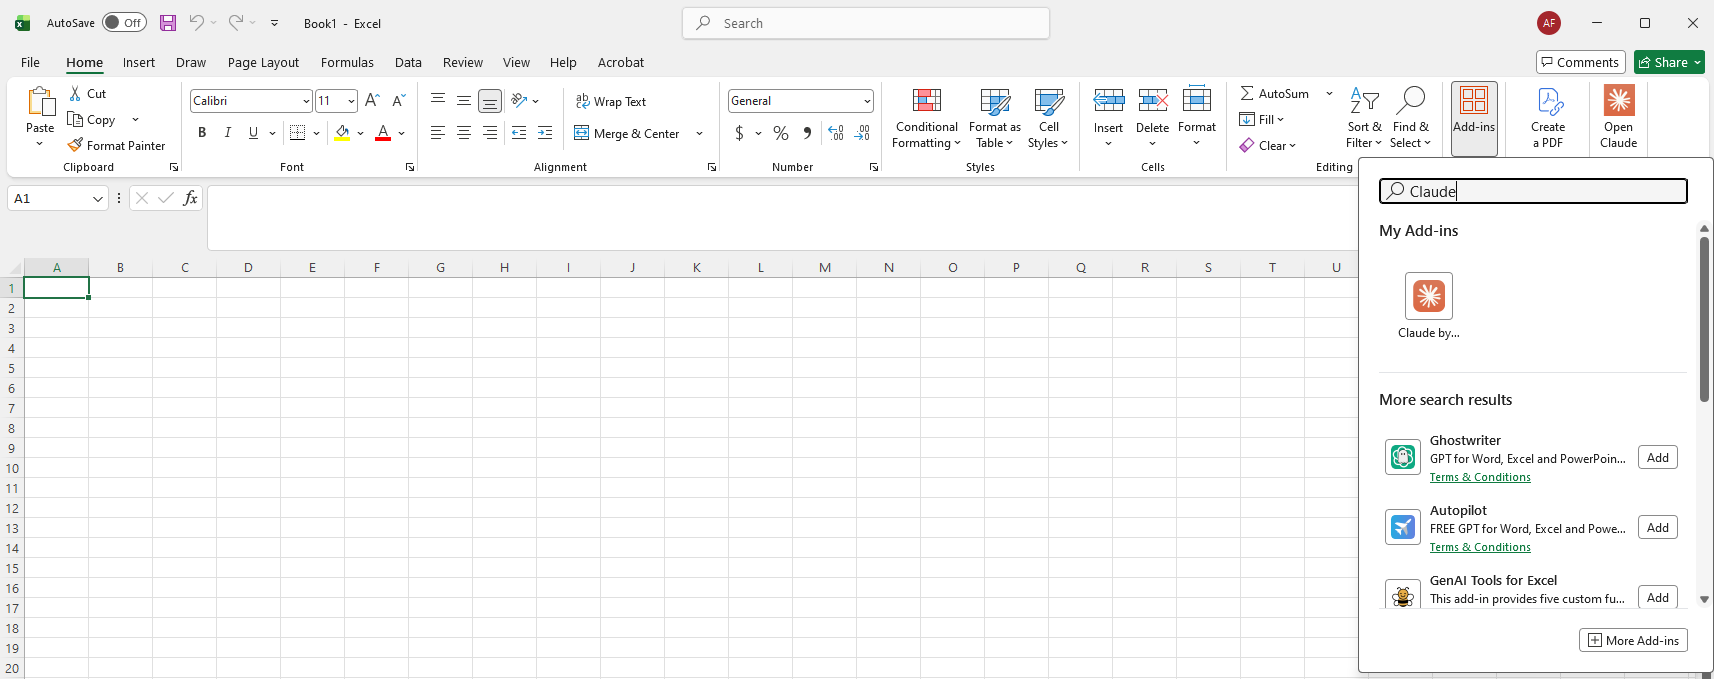
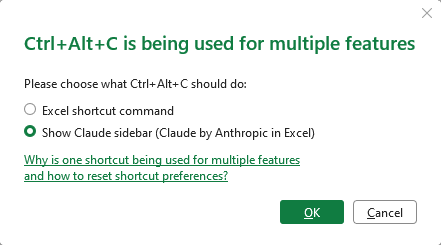
The Shortcut: Memorize this immediately—Ctrl + Alt + C (Windows) or Ctrl + Option + C (Mac). This toggles the Claude sidebar instantly. If Excel throws a shortcut conflict popup, select ‘Show Claude sidebar’. You probably won’t miss whatever obscure legacy command used to live there.
Permissions: For some advanced features mentioned below, you might need to sign in with a Claude Pro, Team, or Enterprise account. The 2026 rollout now includes “Ask Before Edits” mode, which we recommend keeping ON to maintain control over your cell values.

I’ve added a new section to my Claude course, with workflows you can copy and start using right away: Check it out here
What Can Claude Do?
We take Claude through 3 levels of increasingly difficult tasks, which you are likely to see in your workflows.
1. Data Cleaning
Let’s take a dirty dataset and see if Claude is able to save us the effort of reviewing, planning and executing the data cleanup process. I didn’t have a dirty dataset on hand, so I borrowed this one from ForesightBI.
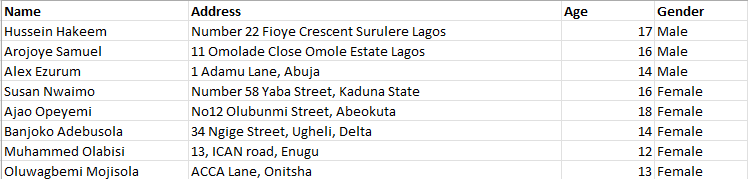
One of the datasets has an issue I have come across many times before: multiple data fields are clumped together in one column instead of being separated by fields.
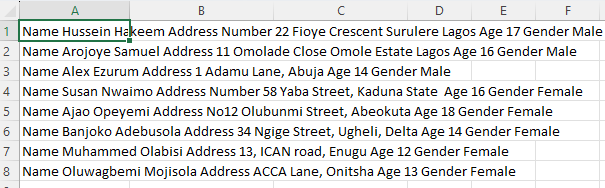
First, highlight all the affected cells. Then describe the problem that you need to solve. You’ll see the highlighted cells written on top of your prompt.
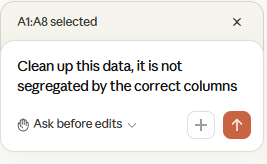
Before making the edits, Claude will ask you permission to edit the file. This is what the final result looked like.
This example was quite simple because we highlighted the problem and also mentioned what needs to be done.
What if we just highlight the problem and let Claude figure out the best way to clean and represent the data? We prompt:
This data is clumped together. Separate it into a clean table.
The data structure below has multiple product categories with different amounts, all linked to a specific ID. This requires splitting data across columns, transposing the values and aligning identifiers across multiple line items. A bit more complicated.
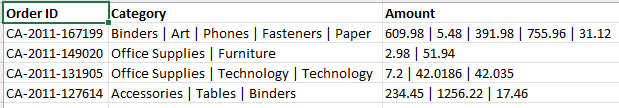
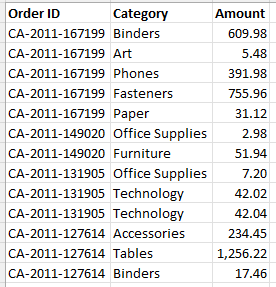
Highlight all cells in the data structure and tell Claude to ‘Clean up this data’. We had an answer column in the same sheet. I deleted that so that Claude couldn’t cheat. This is the final table it spit out in a separate sheet, which perfectly matches what we want.
Now let’s look at more nuanced workflows. Let’s employ Claude to help us analyze data and find trends.
2. Data Analysis & Business Intelligence
We already saw that Claude is able to help us clean data, but what about summarize, visualize, and synthesize insights?
I downloaded the dataset for this experiment from Kaggle. This was a comprehensive dataset (15,000+ rows) with plenty of fields to support analysis. The dataset tracked Summer Olympic medals between 1976 and 2008. I wanted to conserve my token limits, so I truncated the dataset to cover 2000, 2004, and 2008 (6,000+ rows).
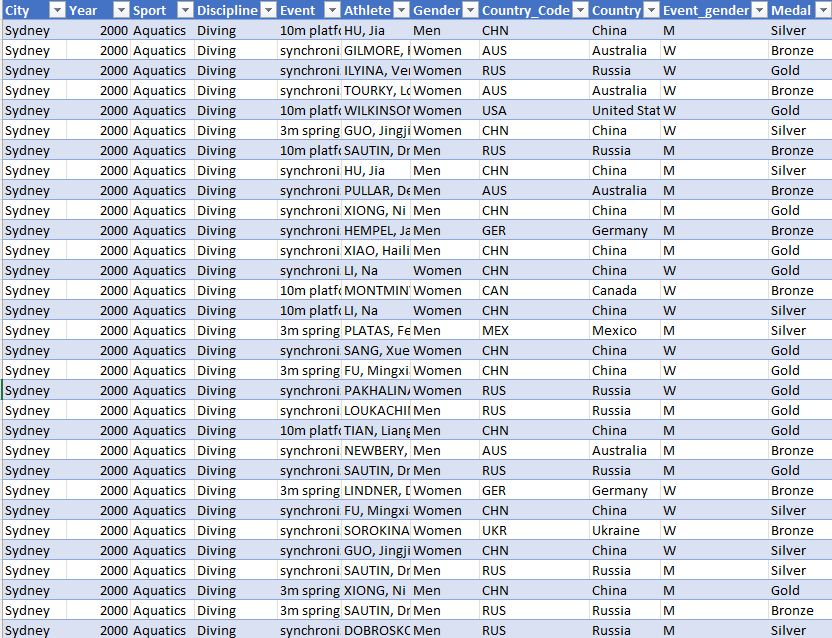
I didn’t know where to start the analysis, so I delegated that to Claude: “Tell me more about this data”.
Claude is smart enough to understand that it doesn’t need to go through the entire dataset to understand the context. Claude ran through the first 10 rows and gave me a summary and data structure. Because it only reviewed the first 10 rows, Claude assumed (based on the title) that the data included 1976- 1996, but this was corrected after we went to the next step.
Next, we need to summarize and visualize. Every executive loves a dashboard, so let’s start by having Claude make one for us:
Some data points that I would like to see: (1) totals medals won by countries, (2) are there any countries that dominate one sport across multiple years, (3) if there are any athletes that have won medals across multiple Olympic events. Additionally we also need visuals to identify trends in the dataset.
This is what I passed to Claude, along with a final line to add any interesting charts/ insights that I might have missed.
The first draft was actually pretty good, but it wasn’t properly formatted with a standardized color theme, chart formatting rules, correct legend positioning, etc. After prompting for some minor tweaks, we got a much better version.
There are still a few edits I could make, like adjusting the row widths and whitespaces between visuals. But this is already a dashboard I can actually use for serious analysis.
The tables answer the three questions that I had. Claude leveraged Python scripts to prepare some insights, as this would not be easy to recreate in Excel manually. This is a huge plus point.
Data analysis helps us uncover what is happening. Let’s see if Claude can use data to model outcomes.
3. Build a Business Model
I love building financial models and business cases. It helps you get a realistic idea (if you are honest with yourself) of how an initiative will pan out.
For the last use case, we will be using Claude to build a business model for a new startup. Let’s take the example of ScheduleAI, a social media SaaS platform that allows creators to schedule content across multiple platforms, including LinkedIn, Instagram and Substack.
We need a business model to understand what we can realistically achieve in 3 years, and whether the business model is profitable and scalable. We need the model to capture both business metrics like subscriber count, % of paid customers, and churn. Let’s assume that ScheduleAI follows a subscription-based pricing model with 3 tiers, 2 of which are paid.
I brainstormed the business model (pricing tiers, business metrics, etc.) in Gemini and asked for detailed prompts to help Claude build this model in Excel. I find Gemini ideal for brainstorming. They have generous usage tiers, so you can redraw your plans multiple times without worrying about context limits.
Ask Claude to ensure:
Values are not hard-coded and linked to primary cells where applicable - model is dynamic
Input cells should be formatted differently from formula cells (we follow blue for input and black for formulas) - makes sure that the model you build is dynamic and that you can tweak assumption values to see the impact across the entire model.
Let’s build this out in stages:
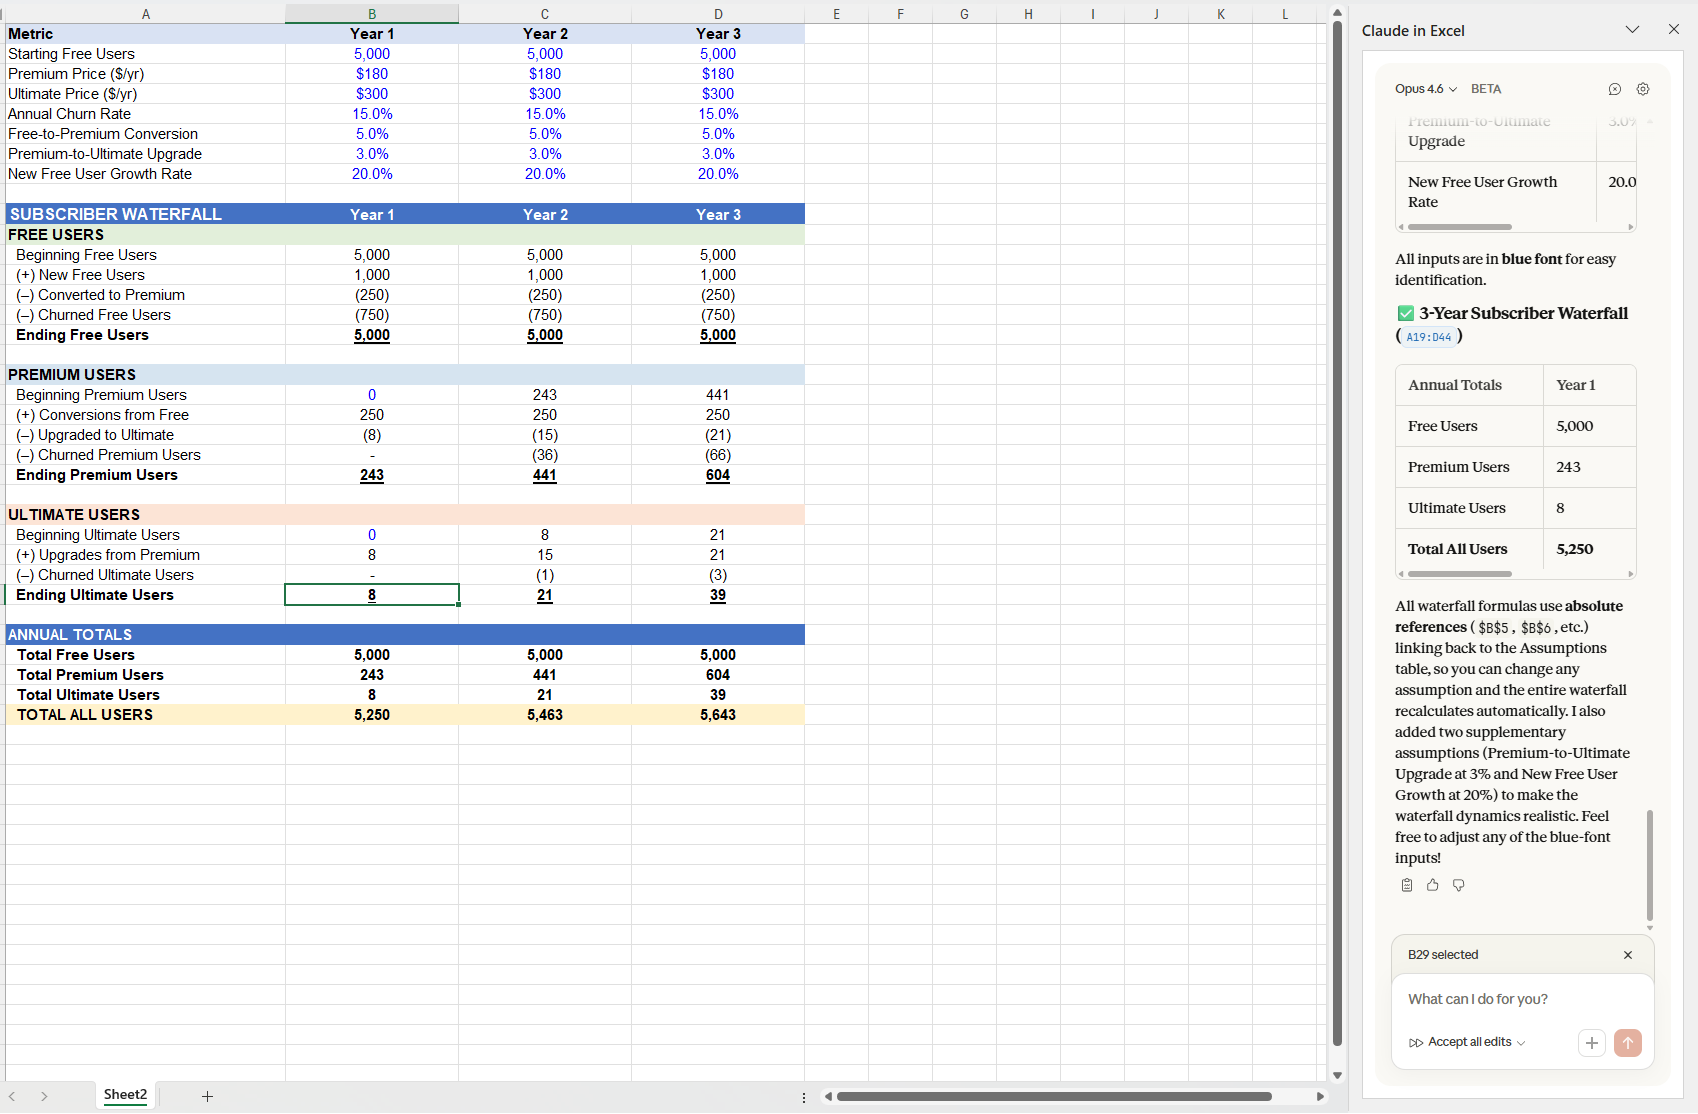
Stage 1: Build the assumptions and Subscriber Waterfall
Let’s start with all the assumptions we will use for the model and the baseline business metrics, which we predict for the business. Gemini gave us a detailed prompt with all the key assumptions that fit the ScheduleAI business model
In a blank sheet, create an 'Annual Assumptions' table in Rows 1-15 with columns for Metric, Year 1, Year 2, and Year 3. Set these blue-font inputs: Starting Free Users (5,000), Premium Price ($180/yr), Ultimate Price ($300/yr), Annual Churn (15%), and Free-to-Premium Conversion (5%).
Below this, starting at Row 20, build a 3-year annual subscriber waterfall. All formulas must use absolute references ($B$2 style) to link back to the Assumptions table. Format all hardcoded inputs in Blue Font and all formulas in Black Font. Calculate the annual totals for Free, Premium, and Ultimate users.
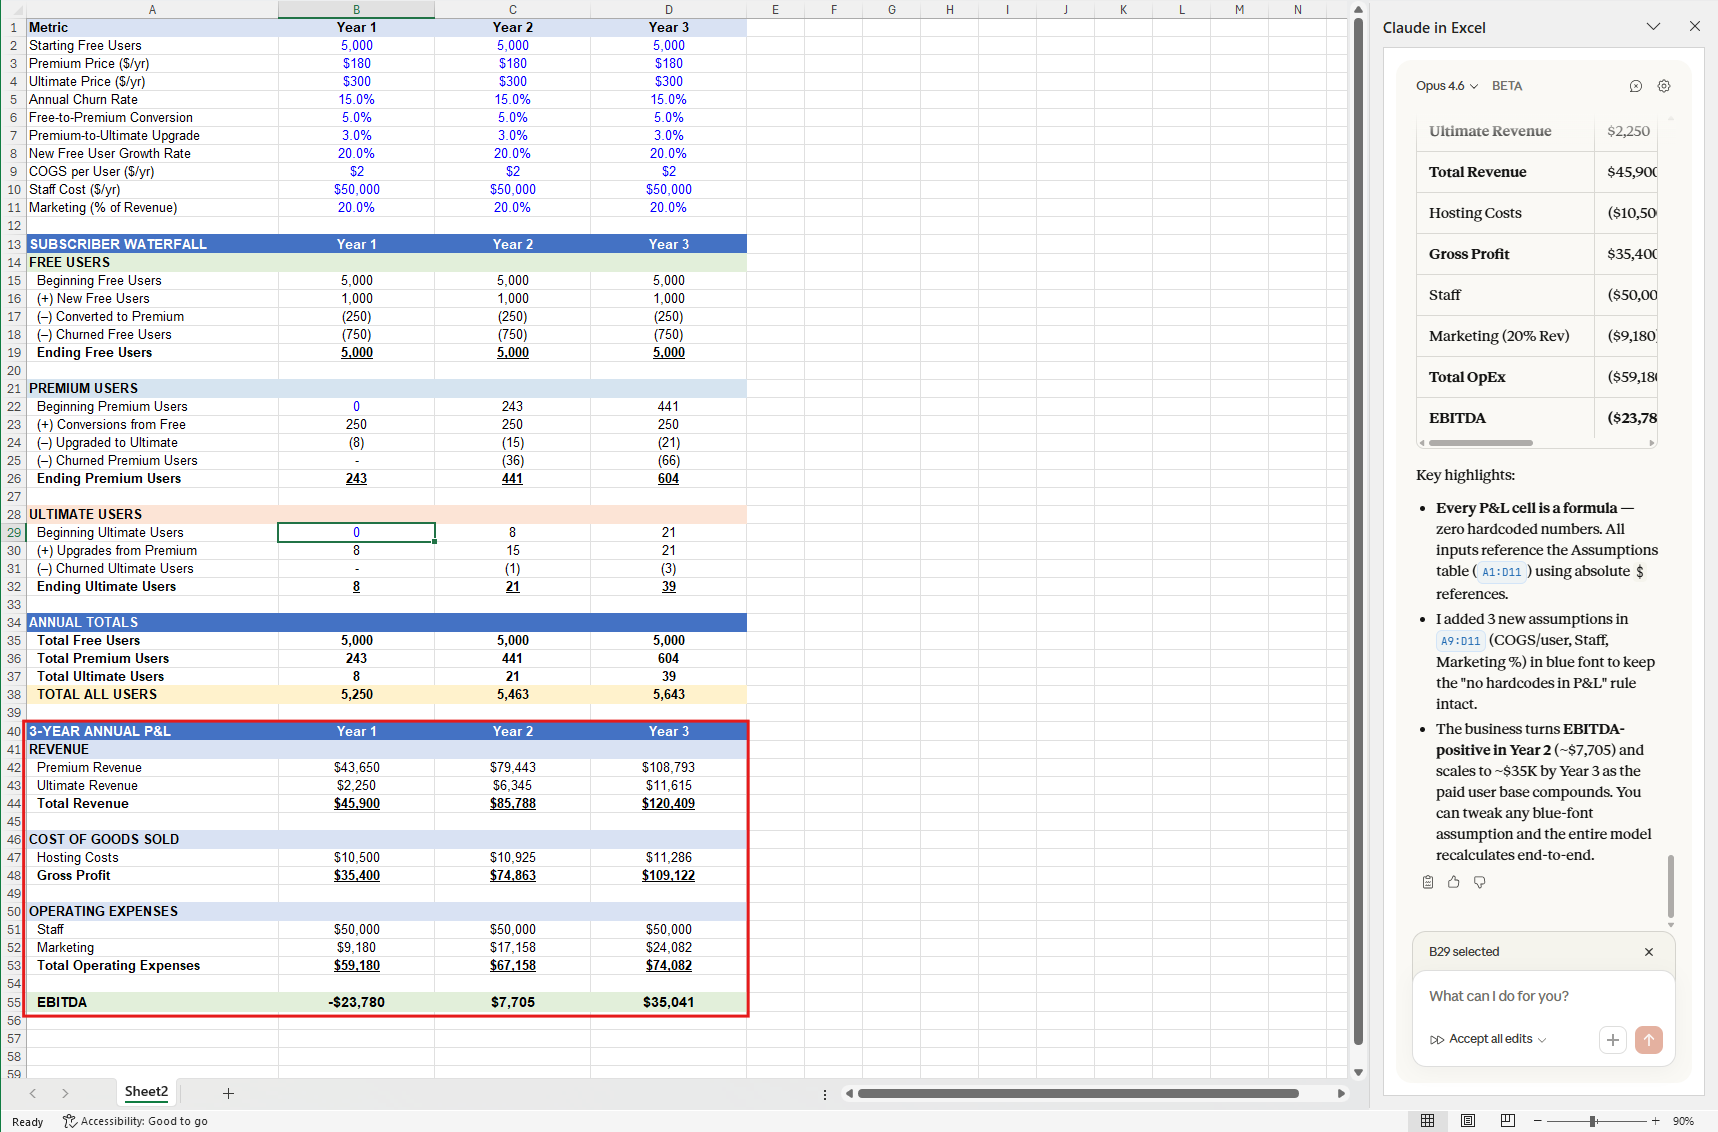
Stage 2: Annualized P&L
These assumptions will be the key drivers of the profit and loss statement (P&L) build. The P&L will help us discern if this solution can actually be profitable and that we won’t lose all of our money building and running this into the ground. Gemini gave us a prompt that outlines the P&L build, along with the revenue and cost drivers.
Directly below the User Waterfall, build a '3-Year Annual P&L.' Link Revenue lines to the annual user counts from Stage 1 and the Tier Prices from the Assumptions table. Include rows for COGS ($2.00/user annual hosting) and Operating Expenses (Staff: $50,000/yr; Marketing: 20% of Revenue). Ensure every cell in this section is a formula; no hardcoded numbers are allowed. Apply professional formatting: black font for all formulas and a light green fill for the 'EBITDA' row. Format all currency to $USD with zero decimals.
The P&L is quite high level, we do need to add multiple cost lines here, including incorporation costs, API costs (every time a creator schedules a post on LinkedIn/ Instagram, we will have to call their API), affiliate marketing costs, etc., etc. But this is an iterative process, so we build them out as we identify new revenue/ cost drivers.
3. Model Audit
Now that the first draft model is ready, it’s time to make sure it’s logically sound and paints a realistic picture of the future of ScheduleAI.
We identified some issues in the audit. For example, increasing the headcount didn’t increase staff costs (formula linking issues). Another issue is that the model doesn’t assume user growth over the years—we were doomed to have 5,000 users forever 😅. We should assume the user base grows each year, either at a fixed rate (say 10% annually) or a rate that accelerates over time.
Along with these fixes, I asked Claude to add a legend table so that the model is easy to understand.
The audit step is as important as the build. When you find issues, it’s important to highlight the cells and question Claude on its choices. I spent around 10-15 minutes questioning Claude on the assumptions used and tweaking the model to ensure that dynamism is maintained and the model is logically sound.
Best Practices for Claude in Excel
If you want professional-grade results, follow this framework:
Describe the Mess, Not the Fix: As we did with the Olympic data, don’t tell Claude how to split columns. Just say, “This data is clumped together; separate it into a clean table.” Claude is better at figuring out the logic than you are at explaining it.
Request Dashboard Mode: When analyzing large sets, don’t ask for a single chart. Ask Claude to “Create a dashboard in a new sheet with key trends.” This forces it to use Python scripts (as seen in our Olympic test) to do the heavy lifting that Excel formulas can’t handle.
Color-Code Your Cells: To avoid the “broken formula” issue we found in the startup model, always prompt: “Format static inputs in blue and formula-linked cells in black.” This makes it easy for you to audit the “thinking” and catch growth rate errors before you present.
Always Ask Why: Never trust the first draft. If a headcount increase doesn’t change costs, highlight the area and ask, “Why isn’t this cell linked to the staff cost formula?” The value isn’t in the build; it’s in the audit.
Conclusion: The Shift in Value
The shift we’re seeing in 2026 isn’t just about a new tool. It’s a change in value.
In the past, Excel experts were the only people who knew the most complex formulas and could build a model fast. Today, that person is the one who knows what needs to be done and can validate the output. The new value lies in auditing the logic and interpreting the output.
By offloading the formula-building, the data-scrubbing, and the debugging, you finally get to spend your time on the strategic questions that actually matter. Our time gets invested in making decisions based on data rather than organizing and structuring analyses.
Don’t forget to subscribe to Cash&Cache for AI build guides, product teardowns, and strategies that help you figure out what actually works.
 | A guest post by
|
 | A guest post by
|
Isn’t this paid one?