I've Been Using ChatGPT Vision as a Data Analyst. Here Are Some Practical Use Cases
ChatGPT Vision can help you with some common tasks in data analysis.
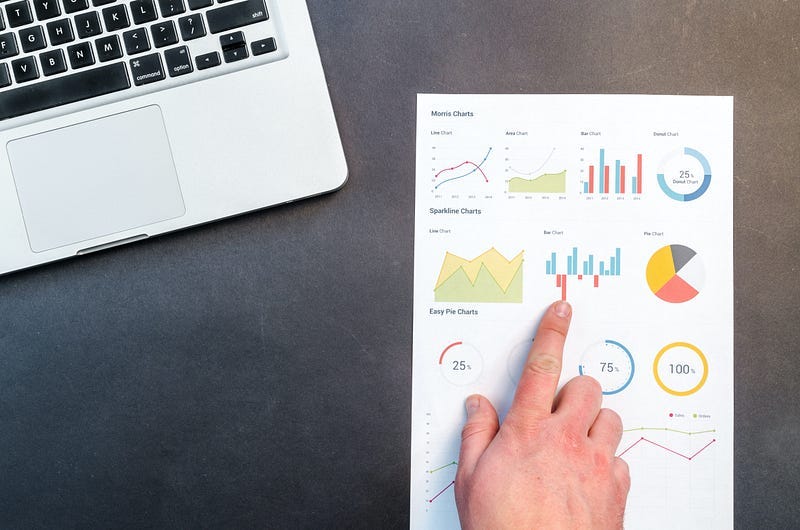
After ChatGPT vision was released, I’ve been using it in different ways as a data analyst and I found it very useful when dealing with some tasks.
ChatGPT vision has helped me draw quick insights from dashboards and visualizations, understand plots that I’m unfamiliar with, produce nice-looking formulas in my Jupyter Notebooks, and more.
Here’s how you can make the most of ChatGPT Vision as a data analyst.
In case you don’t feel like reading, you can watch my video below.
Translate math formulas to LaTeX code for your notebooks
If you read other people’s notebooks using Jupyter Notebooks or any other editor, you’ve probably noticed those fancy math formulas displayed in the cells.
Here’s an example.
Have you wondered how they’re made? Simple, using LaTeX.
LaTeX is used for typesetting documents and makes all those formulas in scientific documents possible. In the past, we had to learn LaTeX commands to create math formulas in our notebooks, but now with ChatGPT, this is as simple as taking a screenshot and asking ChatGPT to write the LaTeX code for us.
Here’s how I translated the image above to LaTeX code.
Once I have the code, I copy and paste it into a markdown cell in Jupyter Notebooks. Then I add the $
at the end and beginning of the code.
$\hat{Y} = \hat{\beta}_0 + \sum_{j=1}^{p} X_j \hat{\beta}_j$
After running the markdown cell, you should see the math symbols.
Now, the previous math formula was a screenshot I took, but sometimes we can’t find the math symbols we want on the internet. In such cases, you can write a math symbol/formula on a piece of paper or a whiteboard, take a photo, and give it to ChatGPT.
Here’s an example.
Here’s the code I got and how it looks in my notebook.
\sigma² = \frac{\sum (y_i — y(x_i))²}{n-k-1}
Data analysts and scientists no longer need to become experts in LaTeX to produce nice-looking notebooks.
Get quick insights from dashboards and visualizations
Sometimes we have to analyze a dashboard or a visualization but don’t have much time to do that. Now we can share the visualizations with ChatGPT and ask it to get some insights from them.
For example, I gave the image of the dashboard below to ChatGPT and it quickly shared some insights.
I found that points 1, 3, 4, 5, 6, and 8 correctly represented what was in the dashboard, but point 2 wasn’t so accurate. Overall, ChatGPT drew useful insights.
Now, the dashboard above had basic plots, but what if we have to read a report that has visualizations that we’re not familiar with? ChatGPT Vision can help with this too.
Understand visualizations you’re not familiar with
There are different ways to plot data, but it’s not easy to understand every single plot out there. For example, I suck at reading heatplots. I learned how they work and even built a couple in the past, but I use them so rarely that I struggle to understand them in reports.
The other day I was reading this analysis about The best Mario Kart character according to data science and I found three heatmaps. As you might expect, I had a hard time understanding them, especially one that had many zeros in one row.
What did I do? I shared the visualization with ChatGPT and asked for an explanation.
Here’s what ChatGPT answered.
Now I know the Standard Kart and Standard are the baseline of the two heatmaps above.
In case you have a dashboard and you don’t understand one visualization in particular, you don’t need to isolate the visualization, but share everything and ask it to analyze a particular area.
In the dashboard below, I had a hard time trying to understand on my own why the bars in “Accumulated Revenue” didn’t have the same starting point ($2M).
Thanks to ChatGPT, I quickly realized that the bars in the chart show the sum of revenues, so, for example, the height of the “Upsell Revenue” bar represents the total of “Previous Revenue” + “New Revenue” + “Upsell Revenue,” while the final total accumulated revenue is the sum of all previous categories minus the lost revenue.
That’s it! That’s how I’ve been using ChatGPT Vision as a data analyst so far. If you have a use case that I didn’t include in this article, share it in the comment section.
how about using the same for financial system use cases