
How to Create Professional Visuals with AI
How to create infographics, diagrams, mind maps, and more using AI


I’ve loved visualizations since I worked as a data analyst.
Back then, I had to use code or learn complex apps to create them.
Things have changed a lot thanks to AI! Now, anyone can create gorgeous visuals with a few clicks and simple prompts. Today’s article isn’t a guide to Nano Banana or any particular tool. Instead, we’ll explore the best ways to:
Turn your text and ideas into multiple visuals with one click
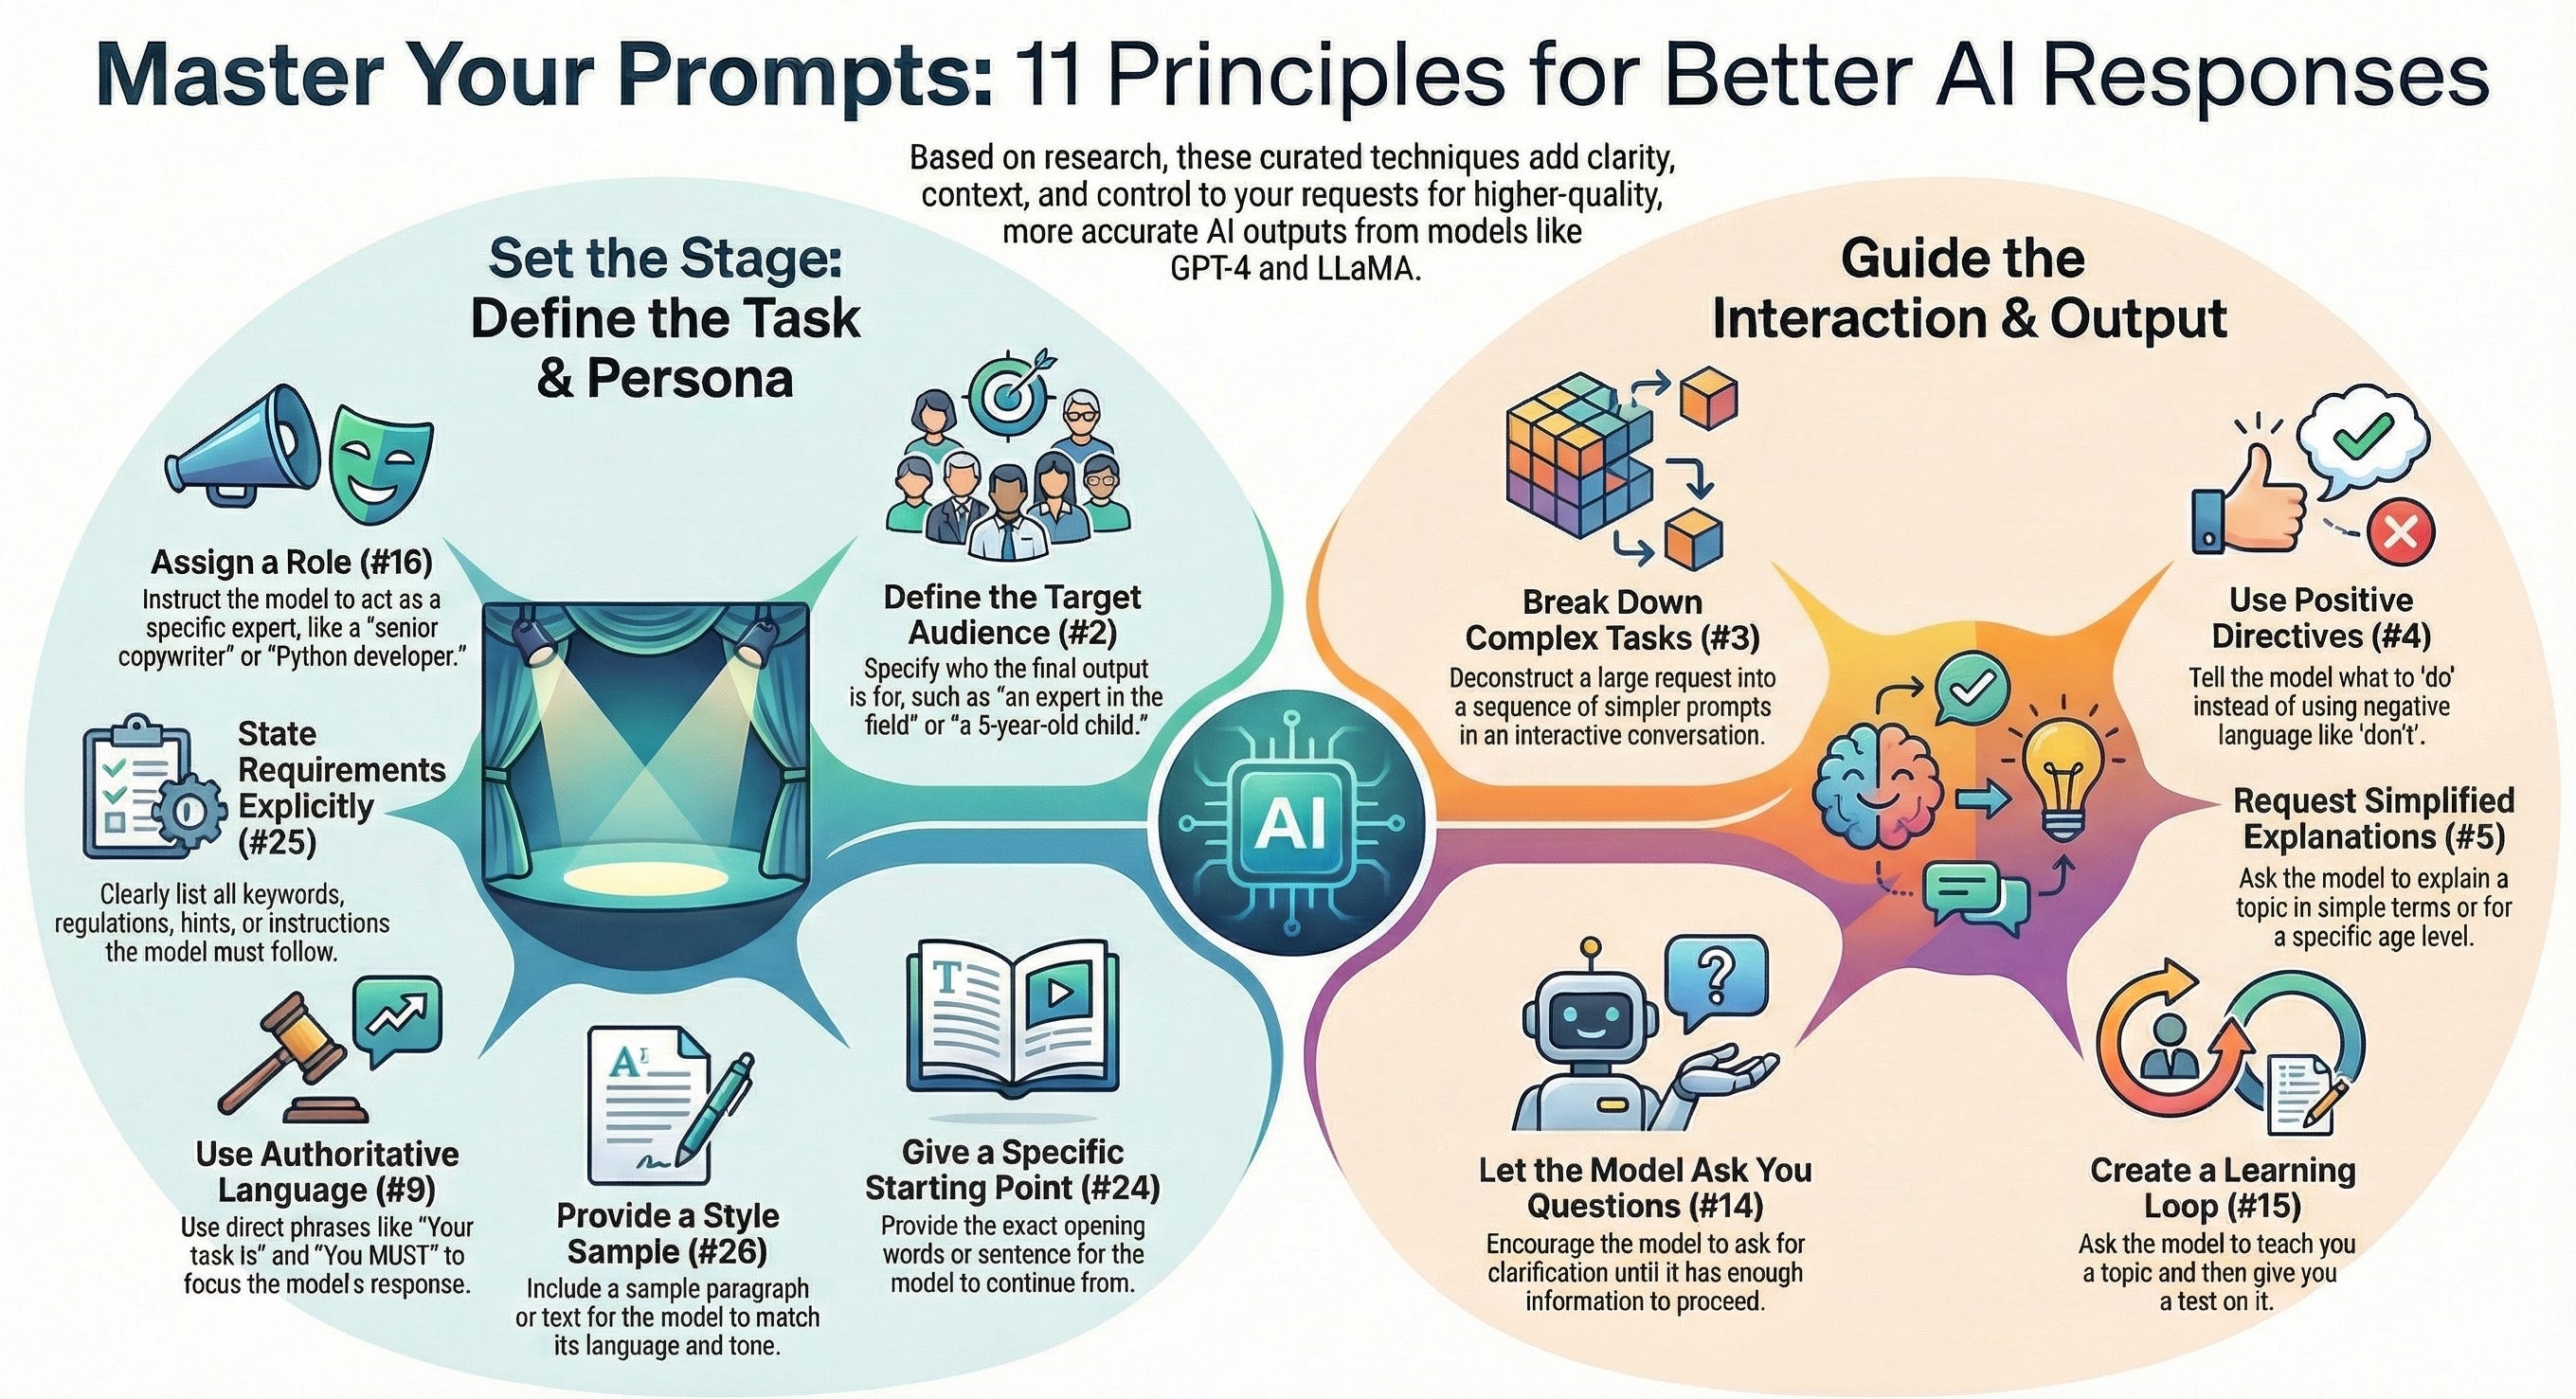
Turn reports, manuals, papers, and PDFs into infographics (and how to avoid AI slop)
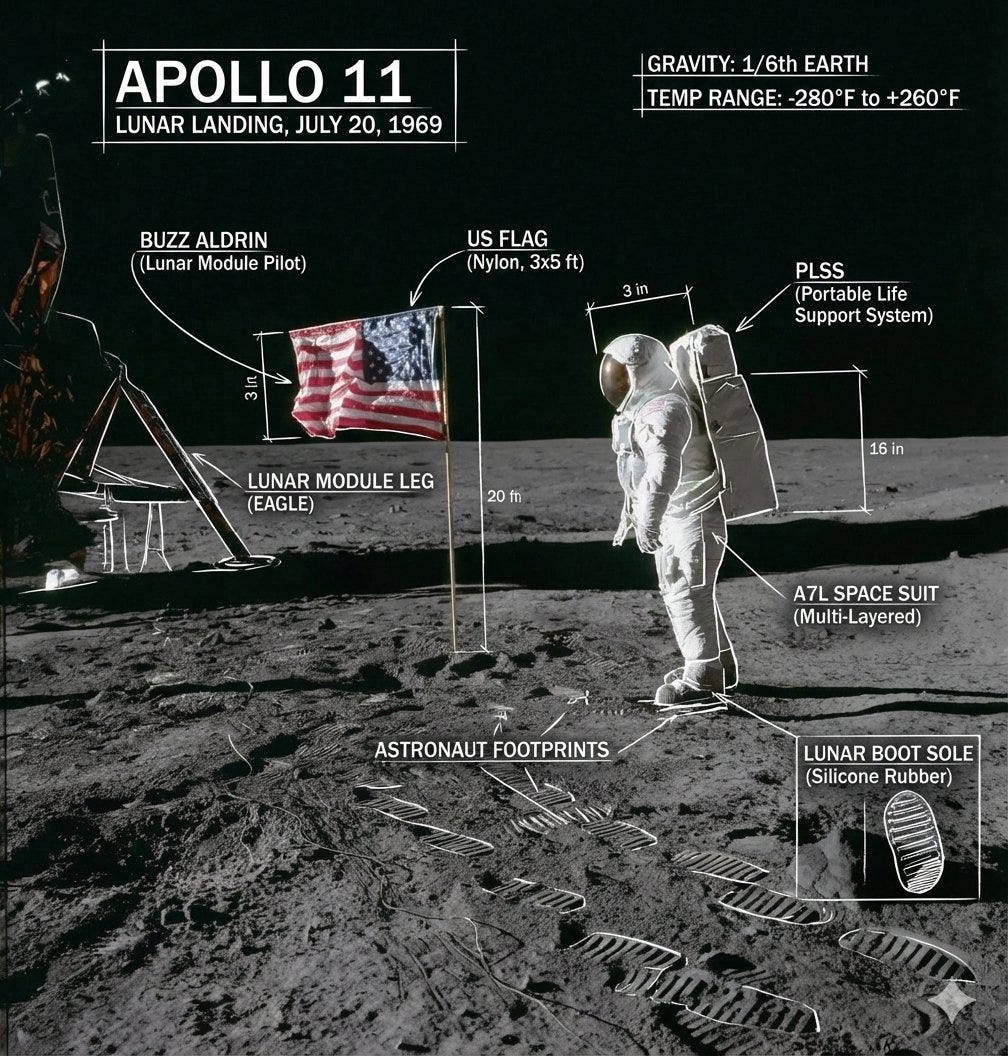
Turn photos into annotated diagrams (only here we use Nano Banana)
As a bonus, I’ll show you a tool to create dynamic visuals like this race bar chart (this isn’t an AI tool, but it’s still great for storytelling)
Keep reading if:
You want to add professional visuals to presentations
You’re looking to captivate your audience with amazing infographics, diagrams, mind maps, race bar charts, and more
You love bringing ideas, concepts, and data to life through visuals
In the next section, we’ll see how to generate these visuals, with step-by-step video guides, copy-and-paste prompts, and best practices to avoid AI slop.
Only accessible to paid members (they get all these perks)
P.S. I created a Google Doc with more guides like this. Check it out here
