
I Used Claude to Predict The FIFA World Cup 2026
And the winner is …

Click here to get my FREE Claude course (20+ lessons)
Four years ago, I built a simple Python model to predict the 2022 World Cup.
I wrote every line of that old model myself. I didn’t build a sophisticated model, but the project still took me weeks.
This time, I didn’t write a single line of code. I told Claude what I wanted in plain English, and it pulled the data, built a smarter model, tested it on the last two World Cups, and even made the charts you’re about to see.
I just made the calls on what to build.
Here's why this matters to you, even if you think soccer is the most boring thing on earth. Swap "49,000 soccer matches" for "five years of your bank statements" or "that sales export you've never had the time to open." Same machine.
The hard part used to be writing the code. Now it’s knowing what to ask for, stress-testing a plan, pushing back, and double-checking the outputs.
The World Cup is just a fun way to show you how that works.
Oh, and one more thing: this is the biggest World Cup ever. 48 teams, kicking off June 11th across the US, Canada, and Mexico (the US is hosting 78 of the 104 games!).
Let’s predict the winner with Claude.
In this guide, you’ll get:
How Claude’s prediction model works (in plain English)
The favorites, the most likely bracket, and the winner
What this Claude project means for you (even if you hate soccer)
How Claude’s prediction model works
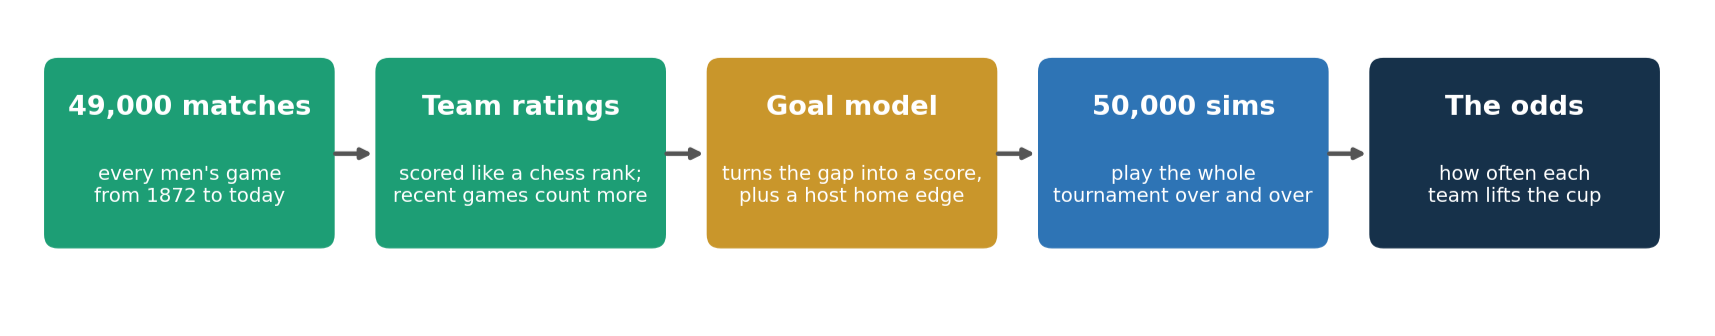
Here’s what I had Claude do, in four steps.
Every game, not just World Cup matches: I had Claude pull every men’s international since 1872. That’s about 49,000 matches, including all the friendlies and qualifiers my old model skipped. Recent games count more and older ones fade out (a game from last month matters way more than one from 2014).
Rate every team: I asked Claude to give each team a strength score using something called Elo. If you’ve ever played chess online, you’ve seen it: win and your number goes up, lose to someone weaker and it drops a lot. Same idea, just for national teams.
Turn the ratings into a score: Claude turns the gap between two teams into a likely scoreline, with a bonus for the three hosts playing at home.
Play the World Cup 50,000 times: Instead of guessing one bracket, I had Claude play the entire tournament 50,000 times and count how often each team won. That’s where the odds come from.
If you want to dive into the more technical details, I left it all in the "Under the hood" section at the end.
I tested it on the World Cups 2018 and 2022 first
Before trusting the model, I had Claude run it on the last two World Cups, using only the data that existed before each one kicked off.
2022 went well. The model made Argentina a co-favorite, second only to Brazil, and Argentina won. My old model’s one and only pick was Brazil, who went out in the quarters. Having the real winner sitting near the top is a much more useful answer.
2018 was a miss. Why? The model loved Brazil and Germany. France won. It had France down in fifth.
Here’s the thing, though: soccer is genuinely hard to predict. Across all those games, the model called the right result about 52% of the time, which is actually decent for a sport with this many upsets. The new model isn’t trying to be magic. It’s trying to give honest odds instead of one overconfident guess.
Click here to get my FREE Claude course (20+ lessons)
The favorites
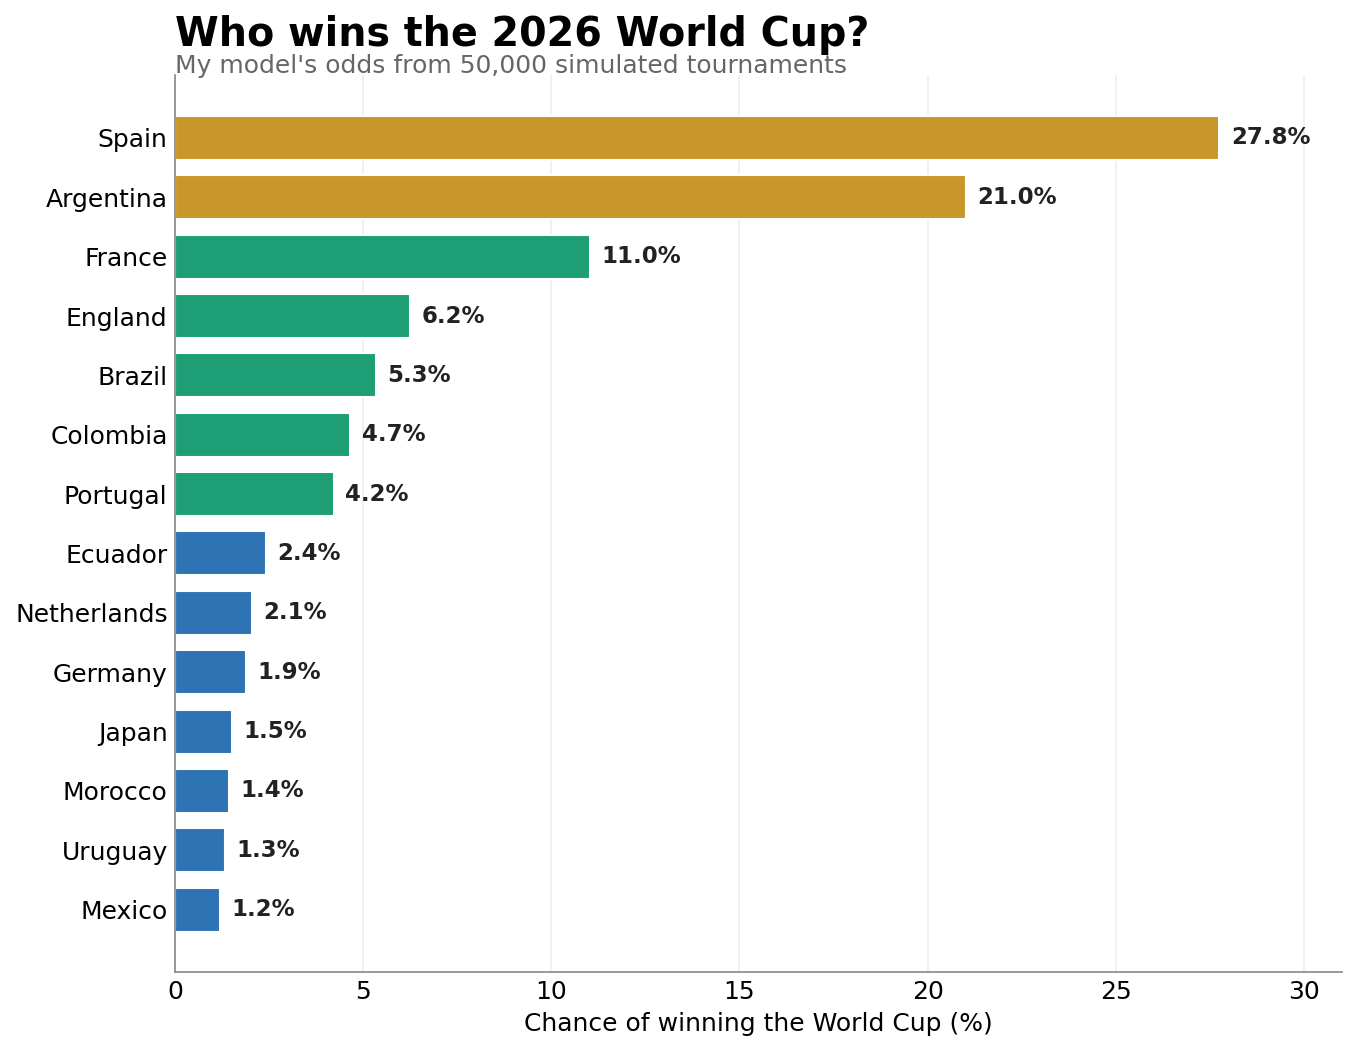
Two teams stand above everyone else.
Spain comes out on top at about 28%, with Argentina right behind at 21%. Together, that’s almost half the field’s chances sitting with just two teams. Then there’s a cliff. France is the best of the rest at 11%, and after that, England, Brazil, Colombia, and Portugal are all bunched in the mid-single digits.
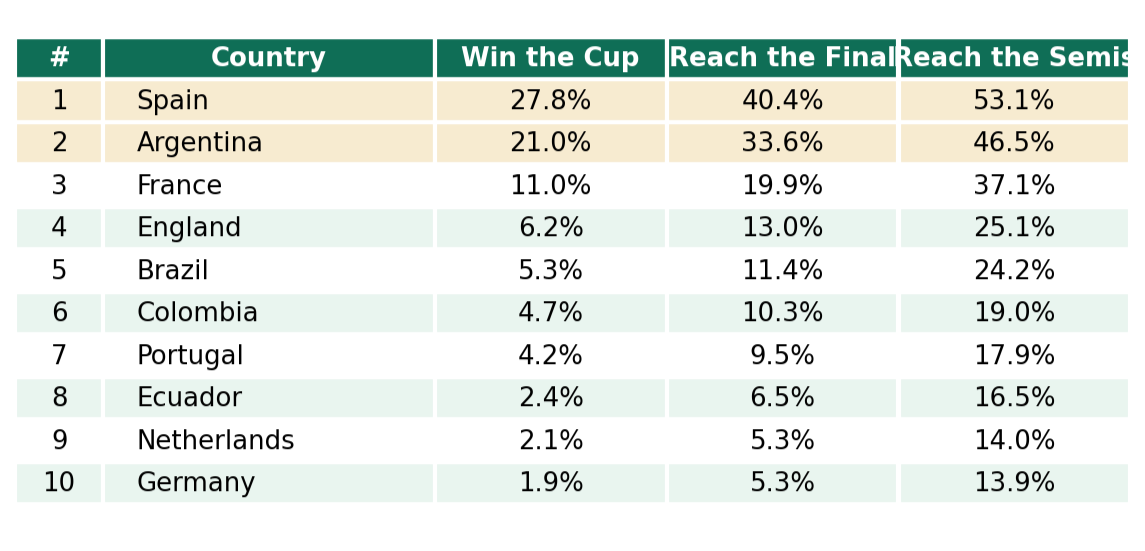
Here’s the full top 10, with the odds of winning it all and of going deep into the tournament:
The bookies also have Spain on top, so we agree on the headline.
The difference is they spread the love around more and rate France and England higher than I do (well, than Claude does). My model is just more stubborn about Spain and Argentina, because on recent results those two have been ruthless.
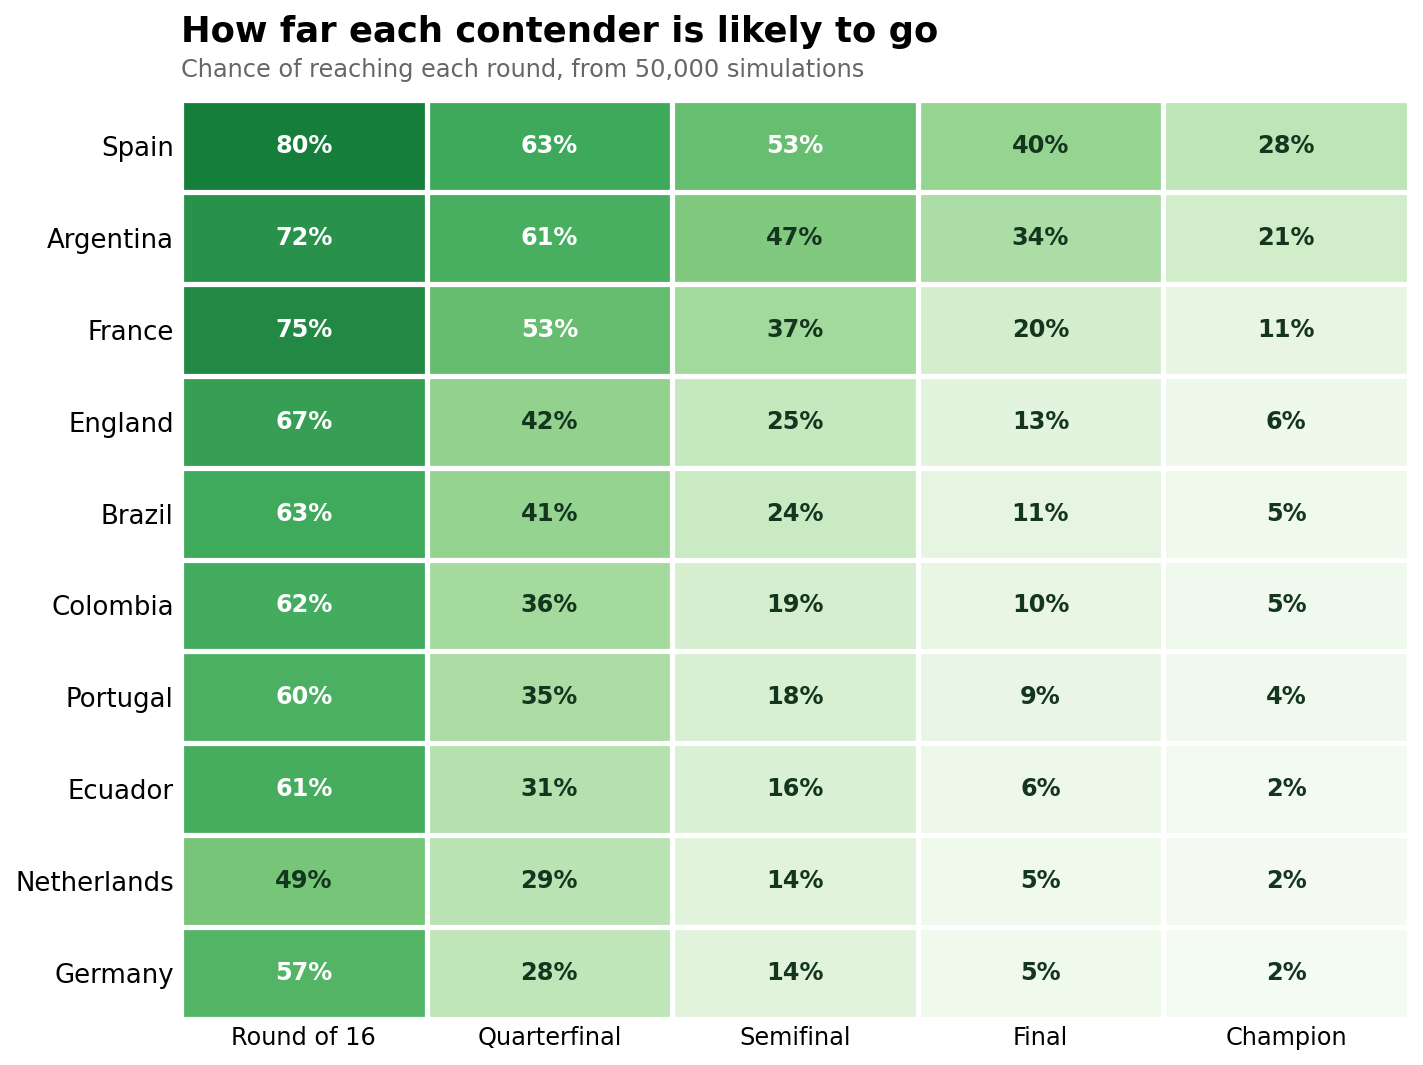
One more way to look at it. The darker the box, the more likely a team makes it to that round:
The most likely bracket (and the winner)
Put it all together and you get the single most likely path through the World Cup.
The model sends Spain and Argentina to the final, with France and England losing in the semis. And the team it has lifting the trophy at MetLife Stadium on July 19?
Spain
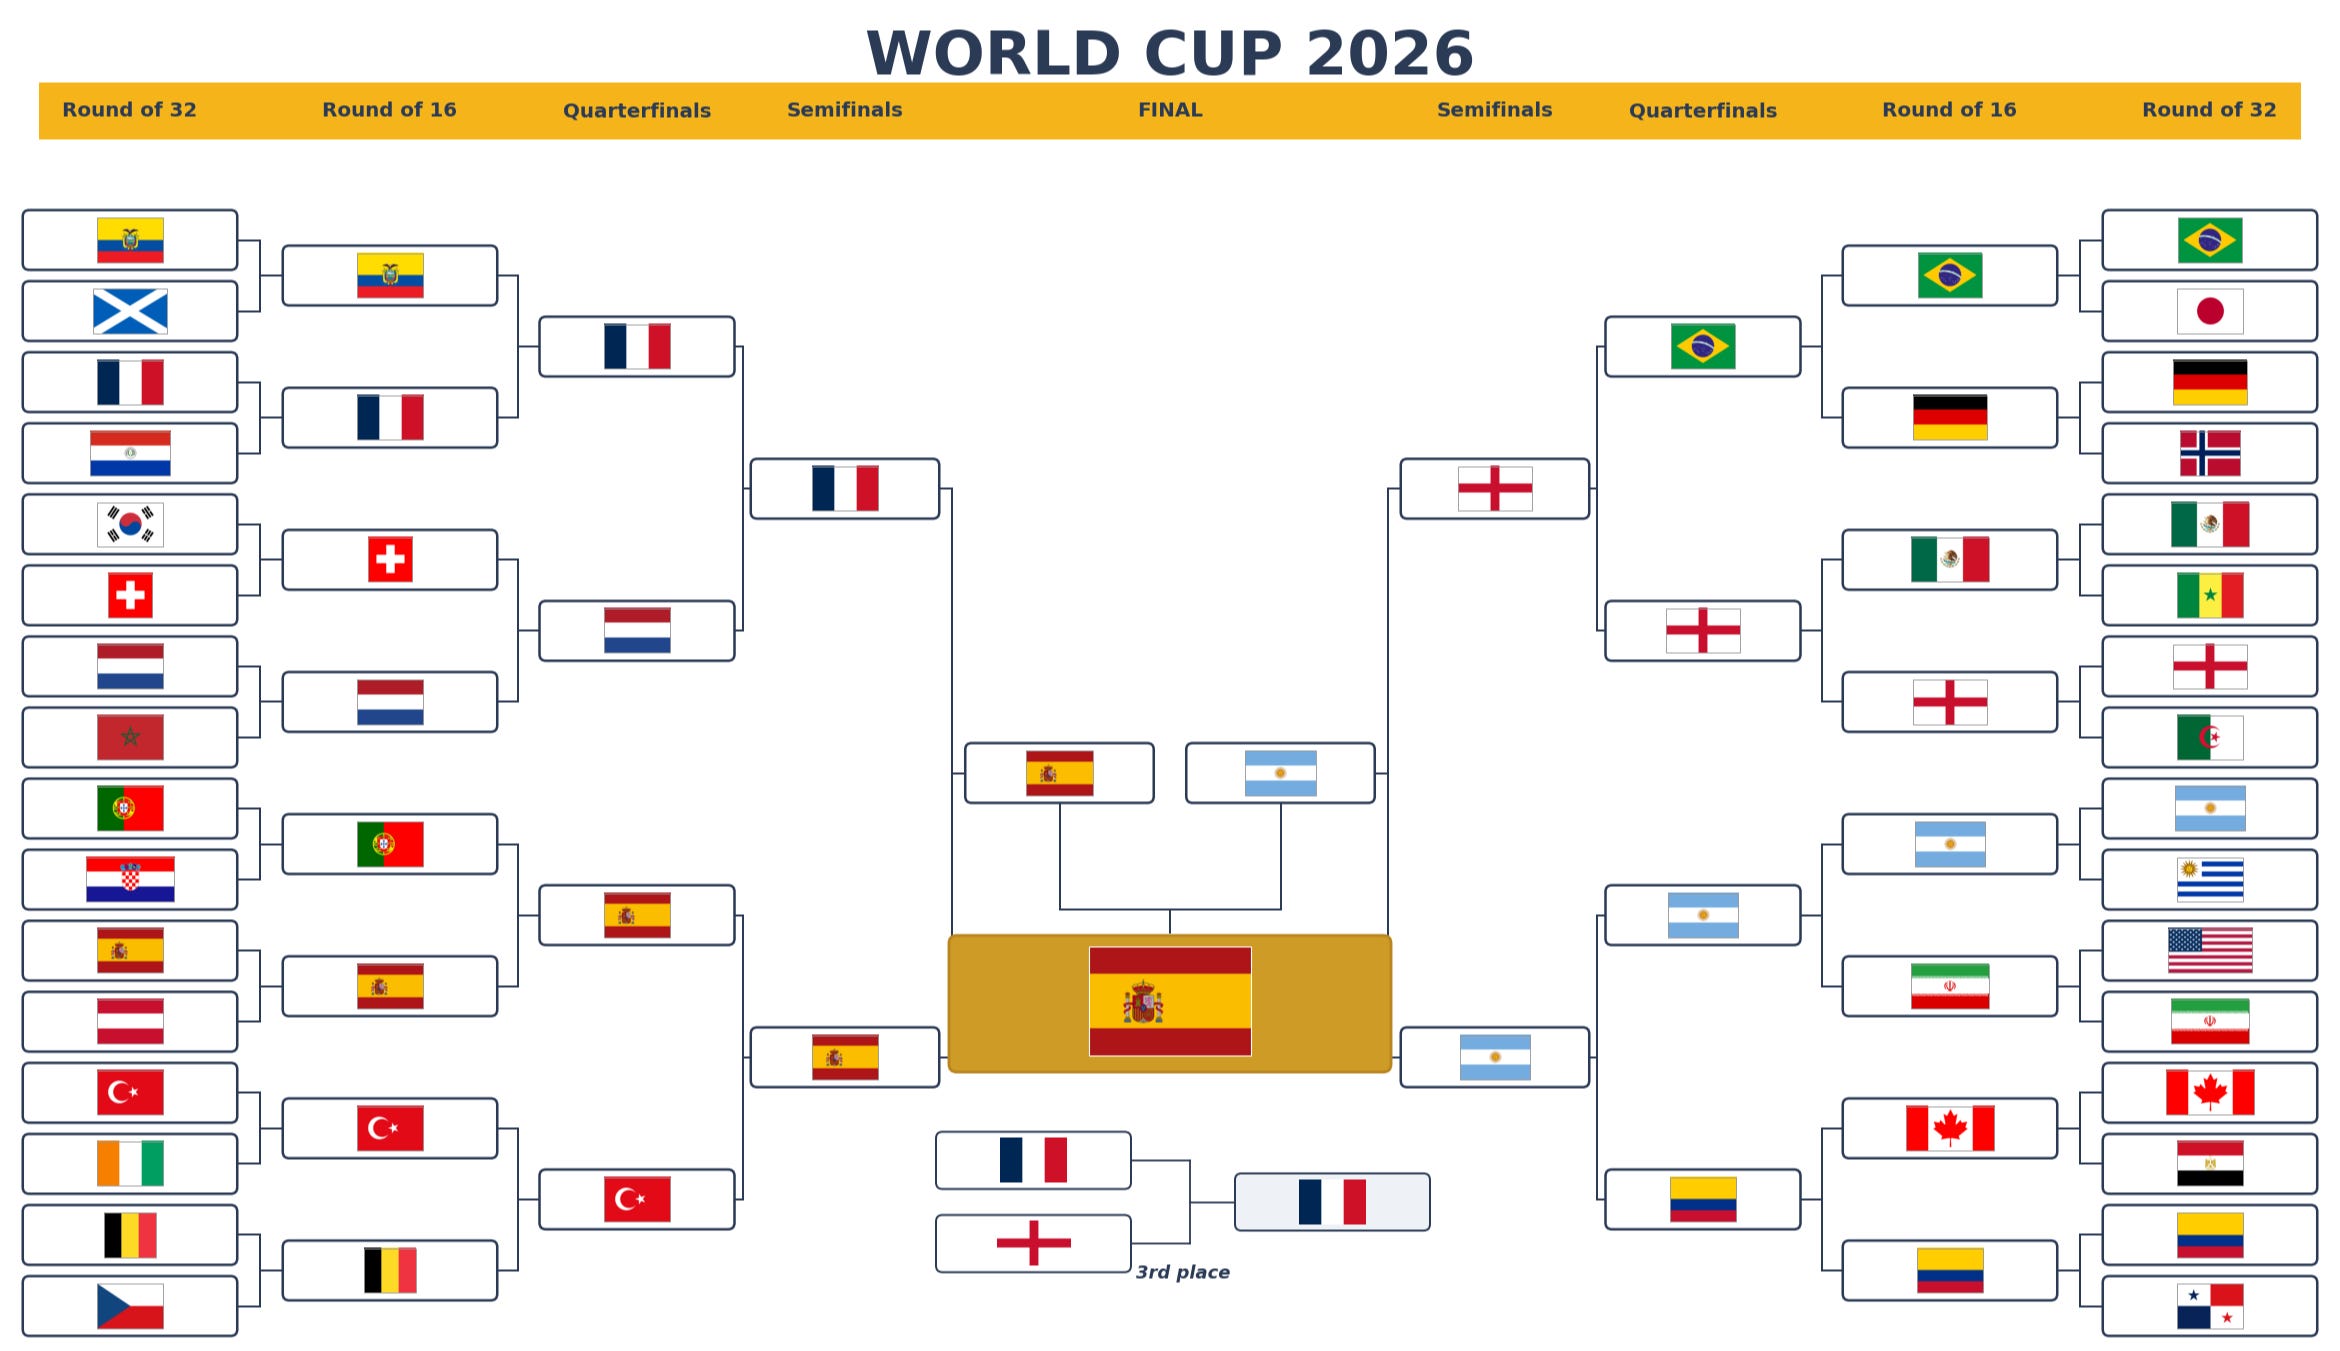
Will it play out exactly like this? Almost certainly not (that’s the whole reason I ran it 50,000 times instead of once). One bracket is just the most likely story out of millions.
What this means for you (even if you hate soccer)
Here are a few lessons to keep in mind for your next Claude project:
1. Your messy data is finally useful
The hardest part of a data project always used to be the data. Here, Claude chewed through 49,000 matches without blinking. For you that pile could be five years of bank statements, a folder of PDFs, or a sales export you’ve never had the time to open.
Point Claude at it, ask it to clean, generate charts, etc. I did this using Cowork, but you can also use Claude in Excel.
2. Stay in the driver’s seat
This wasn’t me firing one prompt and walking away.
Before Claude built anything, I made it show me the exact data it pulled, double-checked it myself, and grilled it on one specific choice: should a game from 1954 count as much as one from last year?
Only once I liked the answer did I tell it to keep going.
That back-and-forth is the actual job now. You supervise, you question the parts that smell off, and you approve the next step. Claude does the building, you make the calls (this beats someone who just types “predict the World Cup” and hits enter).
3. I got lucky with the data. You might not
Honest caveat. This went smoothly partly because a clean dataset was already sitting on Kaggle, ready to download. A lot of real tasks won’t be that tidy. The numbers you want might be scattered across a few websites. Ask Claude to go scrape them for you. Don’t expect every data project to be this clean. Expect to wrangle.
4. Ask Claude where it’s weak
My favorite one. I didn’t have to hunt for the flaws myself. I just asked Claude to test its own work, and it told me straight: it would have missed the 2018 winner, and it disagrees with the bookmakers more than I’d like.
That honesty is there, but you have to ask for it. On your next project, don’t stop at the polished answer. Ask “where is this wrong?” and “what are the weak spots?” A good answer that knows its limits beats a confident one that’s hiding them (you can even bake that habit into a skill)
Your turn: can you beat Claude?
The fun part starts now.
Claude’s model says Spain. But we both know soccer’s whole personality is making models and analysts look silly. It happens almost every tournament.
So I want the human take. Yours.
Who's lifting the trophy? Drop your pick in the comments (and throw in the final score if you're feeling brave).
On July 19th, we’ll see who called it better: the model, or you.
One more thing
Anyone can type “predict the World Cup” and hit enter.
Getting a result you’d actually trust is a different thing, and that’s the part I keep digging into. How to point Claude at your own messy data, question the parts that smell off, and walk away with something ready to use instead of slop.
That’s what I share with paid subscribers.
Not my soccer takes :) but step-by-step guides that will help you unlock Claude’s full potential for your own work. If you want to get access to all my guides, consider becoming a paid subscriber 👇
P.S. Here’s how the model works under the hood
Bonus: How the model actually works (skip this if you’re not technical)
Here are the same four steps again, this time with the real math, a few actual numbers, and a bit of the code Claude wrote. My old 2022 model leaned on one idea: the Poisson formula, a simple way to turn an average number of goals into the odds of each scoreline. I kept that part (it still works). I just fixed what feeds into it.
1. Strength, with Elo
Every team starts at 1500 points. After each game the winner takes points from the loser, and how many depends on how surprising the result was, the winning margin, and how big the match was (a World Cup game counts for more than a friendly).
The expected result before kickoff is one line:
expected = 1 / (1 + 10 ** ((opponent_rating - team_rating) / 400))Then both ratings update:
k = importance * margin_bonus          # bigger game + bigger win = bigger swing
elo_home += k * (result - expected)    # result = 1 win, 0.5 draw, 0 loss
elo_away -= k * (result - expected)
Old games fade on their own here, because every new result writes over the old rating.
Run that across all 49,000 matches and you get a strength number for every nation.
Here’s the top of the table going into 2026:
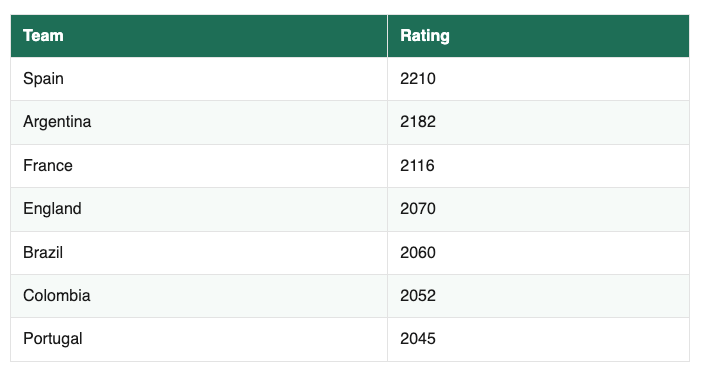
No big surprises at the top, which is a good sign the ratings aren’t junk.
2. Recent games count more
This is the fix for my old model treating 1954 like yesterday. When the model learns how a rating gap turns into goals, it leans on recent matches and lets old ones fade, cutting their weight in half every 2.5 years. A game from the 2022 World Cup is worth about 0.4 of a brand-new one, a 2018 game about 0.1, and anything before 2010 is basically zero. I didn’t pick that 2.5-year number by feel. I had Claude test a whole range of values and keep the one that predicted past results best.
3. From two ratings to a scoreline
Two ratings go in, a likely score comes out. Claude fit a small formula on those recent games that turns the rating gap into an expected number of goals for each team:
expected_goals = exp(0.17 + 0.19 * (rating_gap / 100) + 0.17 * home)Feed both teams’ expected goals into the Poisson formula (the same one from my 2022 article) and you get the odds of every scoreline: 1–0, 2–1, 0–0, and so on. Add them up and you get the win, draw, and loss chances.
Spain vs Brazil on a neutral field, for example, lands around Spain 53%, draw 25%, Brazil 22%.
4. Play it 50,000 times
This is the real upgrade over 2022. For each simulated tournament, Claude:
plays all 72 group games by rolling actual scorelines, then ranks each group on points, goal difference, and goals scored (the real World Cup tiebreakers)
takes the 8 best third-place teams and drops them into the bracket using FIFA’s official rules for the new 48-team format
plays the knockouts, where a tie goes to extra time and penalties, so the stronger team gets a small edge instead of a pure coin flip
Run that 50,000 times, count how often each team lifts the trophy, and those counts become the title odds.
That’s the whole machine. Strength, recency, a scoreline formula, and a lot of simulated tournaments.
Impressive. I also have built a prediction site. Please check. https://cup26matches.com/
Can you please share the dataset used for prediction? Or Maybe a guide for beginners to web scrap the data correctly.