
Behind AI #7: Top Python Libraries Any AI Enthusiast Should Know
Python libraries explained in plain English (with a bit of code).


Python is the language of choice in AI. It offers a large number of libraries that provide great functionality in mathematics, statistics, and scientific functions.
However, Python has applications beyond AI, so there are a good number of Python libraries that you will never use in an AI project.
In this article, I will show you the top Python libraries any AI enthusiast should know. and I will share resources to help you learn them.
Note: I added some lines of code to complement the explanation. That said, you don’t need to be an expert programmer to follow this article.
Python libraries for Data Collection
Every data project starts with data collection. Sometimes the data is available in a CSV format or needs to be extracted from a database. However, when the data isn’t available, you could get public data from the biggest database in the world — the internet. The libraries below help you extract data from the internet with a technique called web scraping.
Request & Beautiful Soup
By using both the Request and Beautiful Soup library we can extract data from websites that don’t run JavaScript.
The requests library helps us make HTTP requests in Python. Thanks to this, we can get the content of a website. Then we use a parser (e.g., html.parser, lxml, etc) and Beautiful Soup to extract any data within the website.
Let’s see an example:
import requests
from bs4 import BeautifulSoup

# sending request and parsing
website = requests.get('https://example.com').text
soup = BeautifulSoup(website, 'html.parser')

# extracting data
headlines = soup.find_all('span', class_='class-example')
data = [headline.text for headline in headlines]
Selenium/Scrapy
Selenium and Scrapy do the same job as Beautiful Soup; however, they’re more powerful.
Both of them can extract data from JavaScript-driven websites. Selenium can be also used for web automation, while Scrapy is fast, allows you to easily export data to a database, and have other functionalities that make it the most complete tool.
Below you will find guides to start learning these libraries from scratch:
Python libraries for Data Cleaning & Wrangling
Once you have the data in a readable format (CSV, JSON, etc), it’s time to clean it. The Pandas and Numpy libraries can help with it.
Pandas
Pandas is a powerful tool that offers a variety of ways to manipulate and clean data. Pandas work with dataframes that structures data in a table similar to an Excel spreadsheet, but faster and with all the power of Python.
This is how you create a Pandas dataframe:
import pandas as pd

# data used for the example (stored in lists)
states = ["California", "Texas", "Florida", "New York"]
population = [39613493, 29730311, 21944577, 19299981]

# Storing lists within a dictionary
dict_states = {'States': states, 'Population': population}

# Creating the dataframe
df_population = pd.DataFrame.from_dict(dict_states)

print(df_population)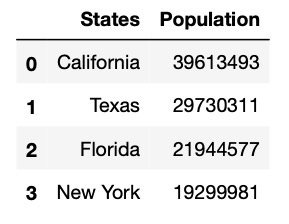
Numpy
Numpy is a Python library with math functionalities. It allows us to work with multi-dimensional arrays, matrices, generate random numbers, linear algebra routines, and more.
When it comes to wrangling and transforming data, some Numpy methods such as np.where and np.select are often used. In addition to that, other libraries such as Matplotlib, and Scikit-learn depend on NumPy to some extent.
Let’s see how to create a two-dimensional array with NumPy.
import numpy as np

b = np.array([[1.5,2,3], [4,5,6]],dtype=float)

IN [0]: print(b)
IN [1]: print(f'Dimension: {b.ndim}')

OUT [0]: [[1.5  2.  3. ]
          [4.   5.  6. ]]
OUT [1]: Dimension: 2
Imbalanced-learn
Imbalanced-learn is a library that helps us deal with imbalanced data. Imbalanced data happens when the number of observations per class is not equally distributed. For example, in the review section of an Amazon product, you will typically see a high number of positive reviews (the majority class) and a low number of negative reviews (the minority class).
We use the imbalanced-learn (imblearn) library to resample our data. For example, you can undersample positive reviews or oversample negative reviews.
Below you will find guides to start learning these libraries from scratch:
Python libraries for Data Visualization
Plots such as pie charts, bar plots, boxplots, and histograms are often used in Exploratory Data Analysis and also when presenting results. Python libraries allow us to make traditional as well as interactive plots.
Matplotlib/Seaborn
Matplotlib is a library that allows us to make basic plots, while Seaborn specializes in statistics visualization.
The main difference is in the lines of code you need to write to create a plot. Seaborn is easier to learn, has default themes, and makes better-looking plots than Matplotlib by default.
Let’s create a barplot of the df_population dataframe we created in the Pandas section.
import matplotlib.pyplot as plt

plt.bar(x=df_population['States'],
        height=df_population['Population'])

plt.xlabel('States')
plt.ylabel('Population')
plt.show()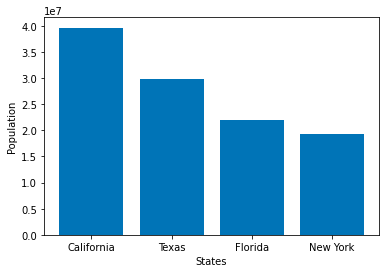
Now let’s create the same plot with Seaborn.
import seaborn as sns

sns.barplot(x=df_population['States'],
            y=df_population['Population'],
            palette='deep')
plt.show()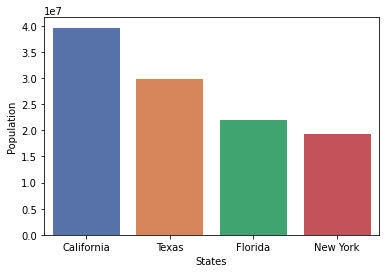
As you can see, we don’t need to specify the axes names in Seaborn (it takes it from the dataframe columns), while Matplotlib needs more lines of code and the plots aren’t good looking at all by default.
Plotly/Bokeh (Pandas integration)
If you want to go to the next level, you should try making interactive visualization with Plotly or Bokeh. Both allow creating a good number of interactive plots and the coolest thing is that you can use any of them to plot directly with Pandas plotting syntax.
Both make it easy to plot interactive visualization, but in my opinion, Plotly creates better-looking plots by default.
Here’s an example of how to create interactive plots with Plotly using Pandas plotting syntax.
import pandas as pd
import cufflinks as cf
from IPython.display import display,HTML
cf.set_config_file(sharing='public',theme='white',offline=True)

df_population = df_population.set_index('States')
df_population.iplot(kind='bar', color='red',
                    xTitle='States', yTitle='Population')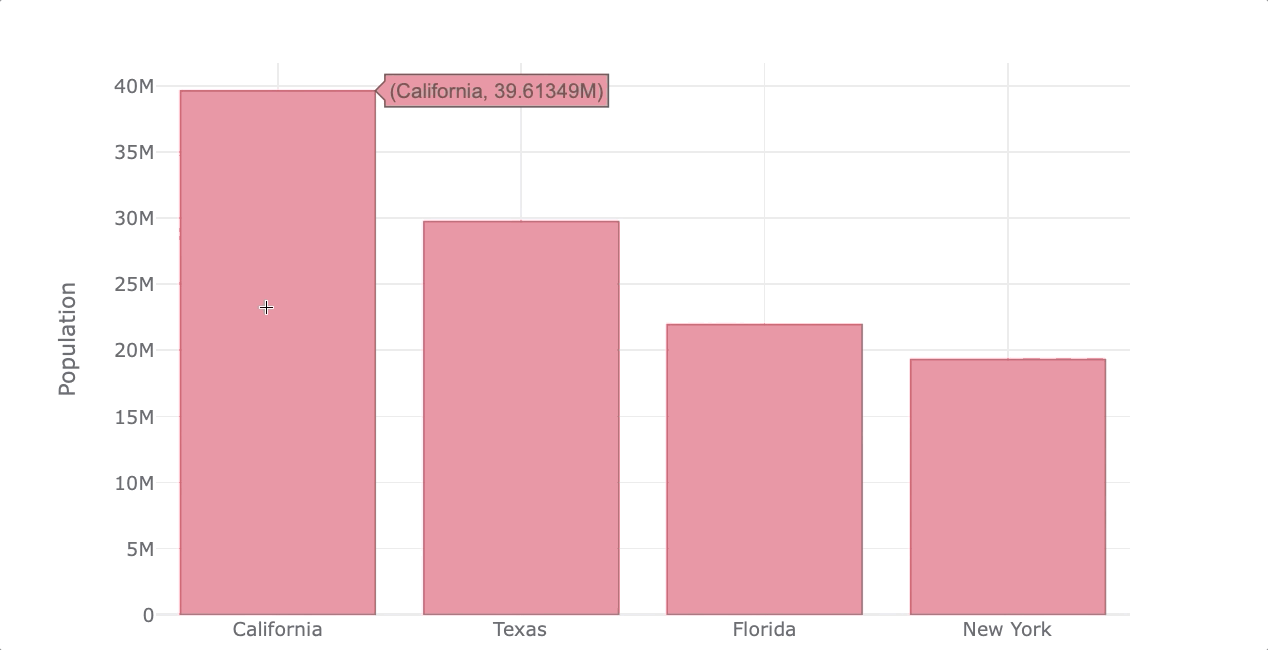
Wordcloud/Stylecloud
Wordclouds allows us to identify keywords in a piece of text. Python has two libraries for this type of graphs —wordclouds and stylecloud.
The first makes basic wordclouds and even allows us to upload our own image as a mask for the wordcloud, while the second creates gorgeous wordclouds with a few lines of codes and offers a good number of high-quality icons that you can use in your wordcloud.
Let’s make a wordcloud of the famous Steve Job’s speech at Standford.
import stylecloud

stylecloud.gen_stylecloud(file_path='SJ-Speech.txt',
                          icon_name= "fas fa-apple-alt")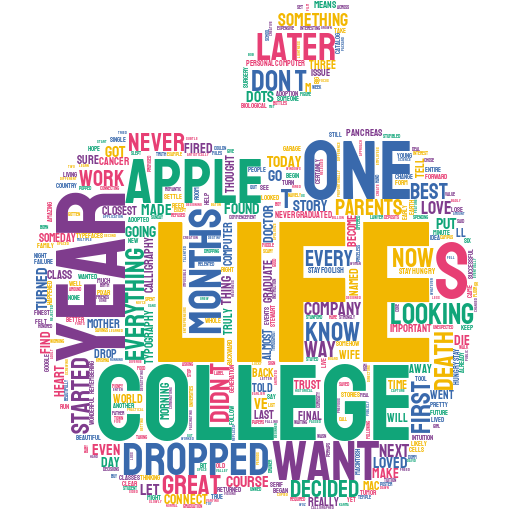
That’s all you need to make this wordcloud! You can remove stopwords and use other functionalities. For more details, check my wordcloud guide.
Below you will find guides to start learning these libraries from scratch:
